Market Comment, August 2021
The question of portfolio performance, both relative and absolute, is one we think about and discuss frequently. In this mid-summer 2021 comment, we’ll share some of our thinking, supported by data.
Diversification is the core strategy.
Most prudent institutions use diversification to manage risk and increase confidence about their ability to deliver on their long-term responsibilities to those they serve, whether pension recipients, advisory clients, charitable beneficiaries, and so on.
Diversification is a strategy to cope with uncertainty about the future; if we knew exactly which assets would perform best in the coming days, we’d be foolish to diversify. We’d want to own only those rewarding assets.
Unfortunately, nobody can know which assets will perform best in the immediate future.
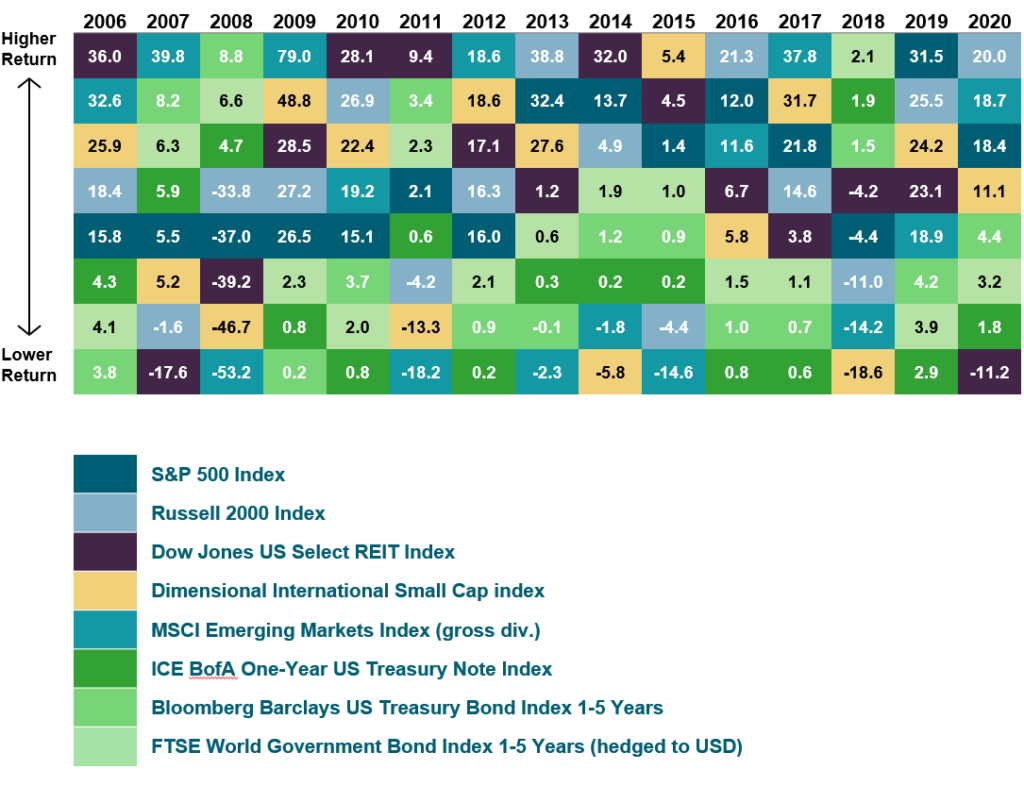

The chart above shows how dramatically the best-performing asset classes change over time. For example, in 2007 emerging markets stocks were the best assets to own, up +39.8%. The next year, they were the very worst, down -53.2% during the global financial crisis. And the year following (you guessed it), they were again right at the top, with an explosive +79% return.
Three essential takeaways:
-
You can’t predict what will perform best year to year.
-
Every hot trend ultimately reverses, and the hotter the trend, the more punishing the reversal tends to be.
-
No diversified portfolio can ever match the performance of the best-performing asset class within the overall portfolio. That’s just simple math.
Value versus growth.
We have solid data on the performance of growth and value stocks starting in 1926. Over the very long run, almost a century since 1926, value stocks have outperformed growth stocks by more than 3% per year on average. However, periods of relative underperformance and outperformance can be long and are intensely episodic.
Stock market history should inform strategy, but can’t ever predict, much less guarantee, the future performance of any investment. That said, the superior long-term performance of value stocks over growth stocks is one of the best-documented phenomena in financial economics.
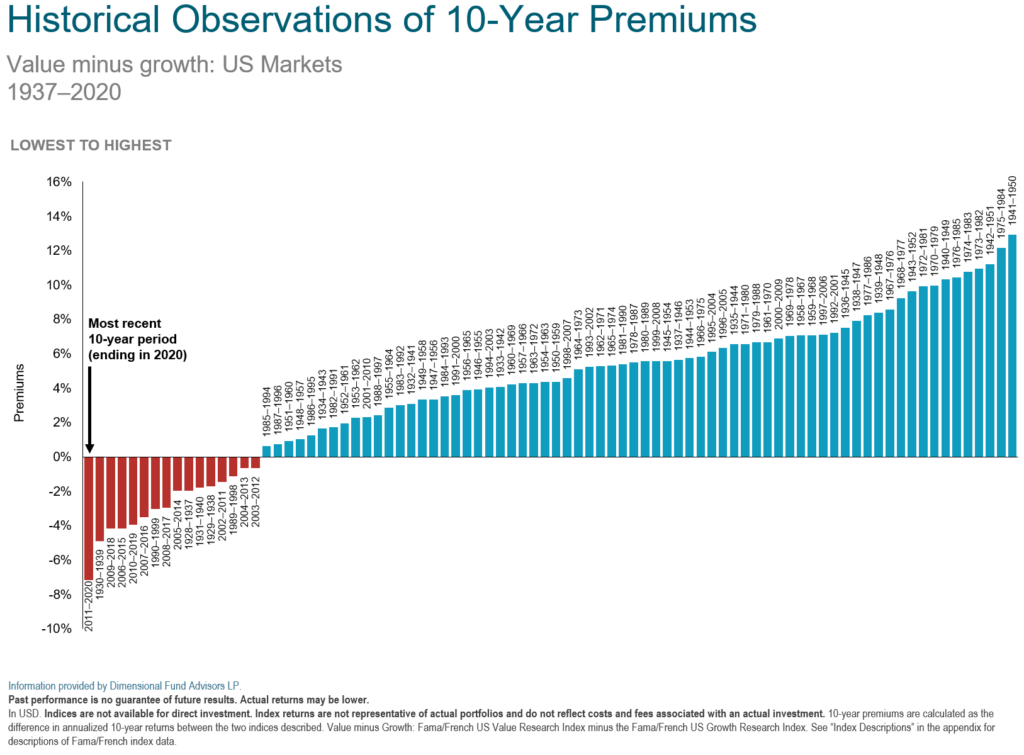
Consider the chart above. Each of the bars above represents one of the 73 ten-year periods over the last 83 years. The red bars at the left show the decades when growth beat value. The blue bars at right are periods when value beat growth.
As you can see, over almost a century the advantage of value has been simply enormous. Yet over the last ten years, just the opposite has been true. Growth has stomped value.
Over the course of my career, which began in 1978, I’ve seen this growth-beats-value phenomenon repeated every decade or two, most dramatically in 1996-2000 and in 2009-2020. In every case but the most recent, periods of growth dominance have been followed by sharp reversals and periods of value advantage. I suspect, but can’t know, that a similar reversal will eventually bring an end to today’s growth stock supremacy.
The fundamental case for value is that it’s better to pay lower prices to own more good stuff today (book value, earnings, dividends, cash flow), than to pay higher prices for faster growth of good stuff (sales, earnings, cash flow, etc.) that you won’t receive until years into the future.
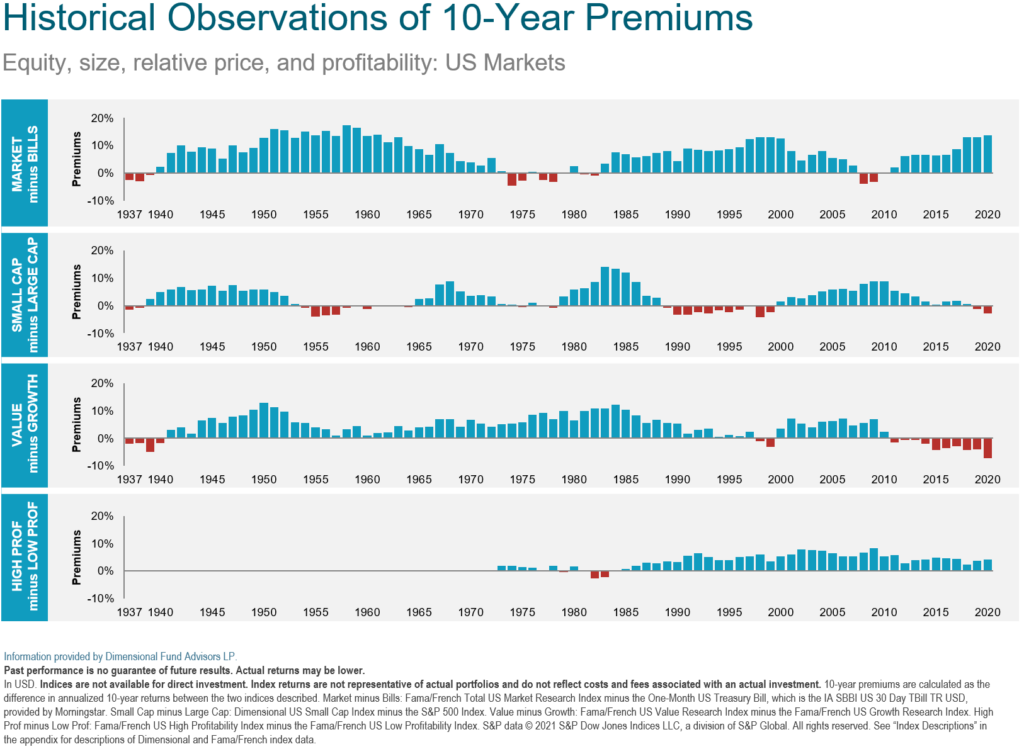
This shows up quite clearly if we look at the returns for trailing ten-year periods in the value minus growth portion of the above chart. The blue bars are periods when value outperformed growth. The red bars are periods of growth outperformance. Again, we see that blue bars are far more numerous than red bars, and also that the period of growth dominance since 2009 has been the lengthiest of the last 80-plus years.
Two data points suggest that this recent dominance of growth implies serious risks for those chasing the current growth and tech bubbles:
-
Since the financial crisis of 2008-09, the Fed has kept interest rates low and encouraged borrowing. Cheap, abundant money rewards speculation, punishes prudence, and inflates asset values. We see this in Bitcoin, SPACs, tech stocks, and IPOs.
-
Low inflation makes distant rewards more valuable today. In 2020, with inflation below 2%, higher projected sales and earnings for a fast-growing tech stock ten years or even twenty years away were worth a lot. Early in my career, back in 1981 when inflation hit 18% and Treasury bonds paid 15%, earnings even five years out were almost worthless. If inflation fears rise, that is likely to be a huge negative for growth stocks, but relatively less of a concern for value.
How we’re performing.
In a nutshell, our managed portfolios have been underperforming because the hot asset class has been the S&P 500 generally, and the growth and tech components of the S&P in particular. At this point, we are more than ten years into the longest period of outperformance by growth over value ever observed. Since the market low during the financial crisis in March of 2009 (March 1, 2009), here are the annualized returns of four widely-followed indices through June 30, 2021.
S&P 500 Value Total Return: 15.5%
S&P 500 Total Return: 17.8%
S&P 500 Growth Total Return: 19.7%
NASDAQ 100 Total Return: 24.5%
A four-point-a-year advantage (growth over value) is huge over time, while a nine-point-a-year return (NASDAQ tech over value) is simply enormous. Even if we compare value to the unmanaged index, the S&P 500, we see a 2.3% annual deficit, which is significant over time. A performance deficit of this size matters.
The numbers above imply the reason for the underperformance. Since the financial crisis, and especially over the last three or four years, a small number of US tech stocks have largely driven global stock market returns. Sometimes called the FAANGs or FAMANGs, the list includes Facebook, Amazon, Apple, Netflix, and Google/Alphabet. We can add Microsoft and Tesla to the list. The remote work environment drove additional revenues and earnings to most of these companies, but even more important, supercharged the performance-chasing aspect of tech stock returns. (These are all returns from the absolute low in March 2009, when the market was down over 60%, through the end of June 2021. Real world returns over longer periods are much lower, of course.)
I’m very aware of the performance deficits of our strategy in recent years, and I find them painful. For most of my career, our clients have enjoyed strong investment results, both absolutely and relative to benchmarks, but not always. The late 90s, during the first tech bubble, we underperformed by double-digit margins for several years, but then delivered huge return advantages when tech crashed and value rallied in 2000-2003.
Worries about inflation.
Is inflation headed higher? In the short term, it has already moved that way. With many firms now reporting strong demand for goods and services following the swift collapse in business activity last year, prices are rising—sometimes substantially. Is this a negative? It depends on where one sits in the economic food chain. Airlines are once again enjoying fully booked fights, and many restaurants are struggling to hire cooks and waiters. We should not be surprised that airfares and steak dinners cost more than they did a year ago. Or that stock prices for JetBlue Airways and The Cheesecake Factory surged over 150% from their lows in the spring of 2020.
Do such price increases signal a coming wave of broad and persistent inflation or just a temporary snapback following last year’s economic collapse due to COVID? We simply don’t know. But we do know several things with confidence:
-
Markets are efficient. Prices reflect the collective opinions of millions of self-interested investors. The future rate of inflation is just one of many factors those investors take into account. The market’s job is to take positive information, such as exciting new products, substantial sales gains, and dividend increases, and balance it against negative information, like falling profits, wars, and natural disasters, to arrive at a price every day that both buyers and sellers deem fair. As sentiment about inflation has waxed and waned in recent months, the market has declined, then recovered.
-
Inflation isn’t an equal opportunity destroyer. Fast-rising prices are bad for investments in general, but they’re much more serious for investments where most of the rewards are expected in future years—in other words, growth stocks. Does that mean we should sell all of our growth stocks and perhaps buy gold or real estate or Bitcoin as hedges against inflation? Of course not. But it is surely another reason to think hard about the relative pricing of growth stocks and value stocks, especially in light of the historical return premium observed for value stocks.
-
Effective inflation hedges are thin on the ground. The few assets with returns positively correlated with higher inflation, such as gold, have abysmal long-term returns. Over decades, stocks will make you rich. Over centuries, gold has zero economic return. You need to be the most brilliant of market timers to make money selling stocks and buying inflation hedges.
My career began in 1978, just as the runaway inflation of Jimmy Carter’s disastrous term as president was beginning to spiral out of control. I’m hard-wired to be worried about rising prices, even decades after the last serious bout of US inflation. I also recognize the great advantages of a sensibly diversified portfolio that tilts toward value.
Two final thoughts:
-
If you want your financial plan to succeed, you must stay diversified. The return assumptions we use in all of our long-term financial planning work are conservative, and driven by Shiller CAPE, which suggests that today’s elevated prices will be followed by lower stock market returns going forward. We’re quite confident a broad portfolio of bargain-priced stocks can provide the returns that will help to make your plan a success. We can’t have any similar rational expectation about the returns of tech stocks trading at 100 times earnings. History suggests a strong possibility those stocks will lose 50% to 80% of their value at some point and compromise any financial plan that isn’t already hugely overfunded.
-
Finally, and as always, we eat our own cooking. My own 401(k) balances and those of TGS staff are invested according to the same asset allocation, and in most cases in exactly the same funds, as are your portfolio and those of our other clients. We’re serious about our own money just as we are about yours.
As always, please know that we’re available to answer any questions you may have about your portfolio and its performance, or to discuss any changes in your financial life that require attention. Call or email us today. And if you know someone who you believe might benefit from our services, we’d be honored if you shared our website or direct contact information with them.
By James S. Hemphill, CFP®, CIMA®, CPWA®/ Managing Director & Chief Investment Strategist
Jim has been a CERTIFIED FINANCIAL PLANNER™ professional since 1982. Jim specializes in complex wealth transfer and retirement transition strategies and coordinates TGS Financial’s investment research initiatives.
Please remember that past performance may not be indicative of future results. Different types of investments involve varying degrees of risk, and there can be no assurance that the future performance of any specific investment, investment strategy, or product (including the investments and/or investment strategies recommended or undertaken by TGS Financial Advisors -“TGS”), or any non-investment related content, made reference to directly or indirectly in this blog will be profitable, equal any corresponding indicated historical performance level(s), be suitable for your portfolio or individual situation, or prove successful. Due to various factors, including changing market conditions and/or applicable laws, the content may no longer be reflective of current opinions or positions. Moreover, you should not assume that any discussion or information contained in this blog serves as the receipt of, or as a substitute for, personalized investment advice from TGS. Please remember that if you are a TGS client, it remains your responsibility to advise TGS, in writing, if there are any changes in your personal/financial situation or investment objectives for the purpose of reviewing/evaluating/revising our previous recommendations and/or services, or if you would like to impose, add, or to modify any reasonable restrictions to our investment advisory services. To the extent that a reader has any questions regarding the applicability of any specific issue discussed above to his/her individual situation, he/she is encouraged to consult with the professional advisor of his/her choosing. TGS is neither a law firm nor a certified public accounting firm and no portion of the blog content should be construed as legal or accounting advice. A copy of TGS’s current written disclosure Brochure discussing our advisory services and fees is available for review upon request. Please Note: TGS does not make any representations or warranties as to the accuracy, timeliness, suitability, completeness, or relevance of any information prepared by any unaffiliated third party, whether linked to TGS’ web site or blog or incorporated herein, and takes no responsibility for any such content. All such information is provided solely for convenience purposes only and all users thereof should be guided accordingly.